In the modern financial landscape, the sheer volume of data can be overwhelming. For the individual investor, separating the “noise” from the “signals” is the key to building a resilient portfolio. As we navigate the complex economic environment of 2026—characterized by the rapid diffusion of AI, shifting global energy demands, and persistent macroeconomic volatility—having a reliable framework for analysis is more essential than ever.
Indicators are not crystal balls; they do not predict the future with certainty. Instead, they act as a compass, helping you understand the current “weather” of the market so you can adjust your strategy accordingly.
Here is a curated guide to the essential market indicators that every serious investor should monitor.
1. The Macro Lens: Economic Indicators
Before looking at specific stocks or sectors, you must understand the broader economic environment. These indicators help you gauge whether the “economic wind” is at your back or blowing against you.
Consumer Price Index (CPI) and PCE
Inflation remains a central focus in 2026. The Consumer Price Index (CPI) and the Personal Consumption Expenditures (PCE) price index are the primary measures of inflation.
- Why it matters: High inflation erodes purchasing power and typically forces central banks to keep interest rates elevated, which increases the cost of borrowing for companies and consumers alike.
- What to watch: If these figures remain sticky or trend upward, expect continued volatility in growth-oriented sectors.
Central Bank Policy (Interest Rates)
The decisions made by central banks (like the Federal Reserve) regarding the federal funds rate are the “gravity” of the financial markets.
- Why it matters: Lower interest rates generally stimulate borrowing and investment, acting as a tailwind for stocks. Higher rates increase the “discount rate” used to value future earnings, often compressing price-to-earnings (P/E) multiples.
- 2026 context: Investors are currently watching closely for pivots toward rate cuts versus “higher-for-longer” scenarios, which heavily influence the attractiveness of fixed income versus equities.
2. Assessing Price Reality: Valuation Indicators
Valuation indicators help you determine if the market is “cheap” or “expensive” relative to its historical norms.
The Shiller P/E (CAPE Ratio)
The Cyclically Adjusted Price-to-Earnings (CAPE) ratio, or Shiller P/E, divides the current stock price by the average of ten years of earnings, adjusted for inflation.
- Why it matters: Unlike standard P/E ratios that can fluctuate wildly based on a single year of earnings, the Shiller P/E provides a smoother, longer-term view of valuation.
- Application: When the CAPE is significantly above its historical mean, it often suggests that future returns over the next decade may be more modest.
Market Cap-to-GDP (The “Buffett Indicator”)
This ratio measures the total market capitalization of all publicly traded stocks in a country against its Gross Domestic Product (GDP).
- Why it matters: It acts as a thermometer for the overall market. If the stock market’s total value is far outstripping the actual economic output (GDP), it may indicate that the market is overextended and decoupled from reality.
3. The Pulse of Psychology: Sentiment Indicators
Markets are driven by math, but they are moved by human emotion. Sentiment indicators measure the collective “mood” of market participants.
The CBOE Volatility Index (VIX)
Often referred to as the “Fear Index,” the VIX measures the market’s expectation of volatility over the coming 30 days based on S&P 500 index options.
- Interpretation:
- Low VIX: Indicates investor complacency and calm.
- High VIX: Indicates fear, panic, and uncertainty.
- Strategic Use: Contrarian investors often look for “spikes” in the VIX as potential buying opportunities when fear reaches an extreme, while a very low VIX can sometimes be a signal to tighten risk management.
The Fear & Greed Index
This is a composite indicator that aggregates several market factors, including stock price momentum, stock price strength, and put/call options, into a single score. It tells you whether the market is currently driven by “Extreme Fear” (often a time to look for value) or “Extreme Greed” (often a time to take profits).
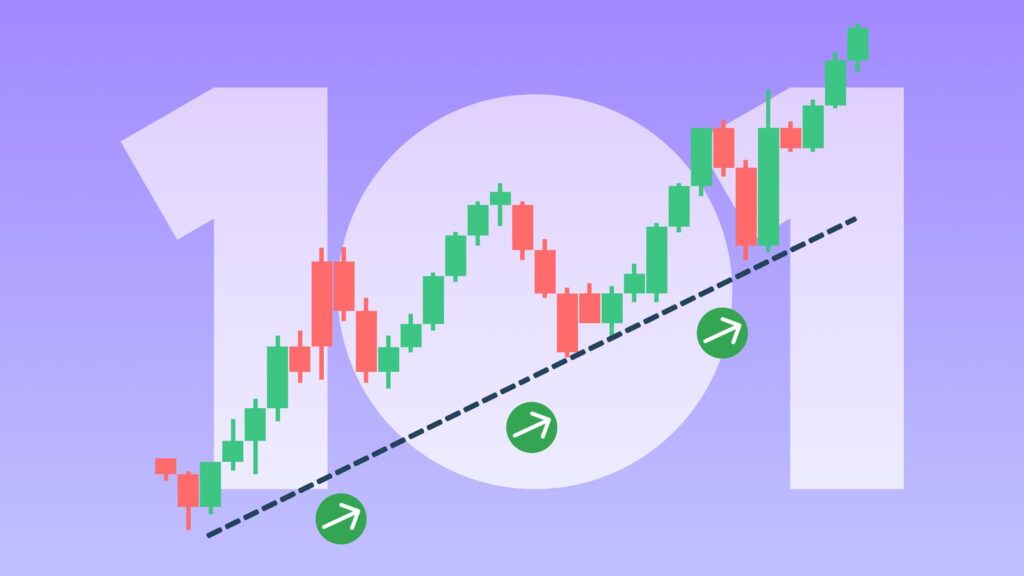
4. Technical Trends: Price Action
Technical indicators use historical price and volume data to help you identify trends and potential entry or exit points.
Moving Averages (50-Day and 200-Day SMA)
Simple Moving Averages (SMA) smooth out price data to create a clearer trend line.
- The 200-Day SMA: This is widely considered the “line in the sand” for long-term trends. If an asset is trading above its 200-day moving average, the long-term trend is generally considered positive.
- The “Golden Cross” and “Death Cross”: When the 50-day moving average crosses above the 200-day, it is called a “Golden Cross,” often signaling bullish momentum. Conversely, when the 50-day drops below the 200-day, it is a “Death Cross,” signaling bearish momentum.
Synthesizing the Data for 2026
In 2026, relying on a single indicator is a recipe for error. The most successful investors synthesize these tools:
- Macro: Check the economic backdrop (Inflation/Rates).
- Valuation: Assess the risk-reward ratio (CAPE/Buffett Indicator).
- Sentiment: Gauge the room’s temperature (VIX).
- Technical: Determine the trend direction (Moving Averages).
For instance, if the macroeconomic environment is uncertain (e.g., sticky inflation), but valuations (CAPE) are reasonable and the market trend (200-day MA) is positive, you might be more comfortable maintaining a disciplined, long-term position rather than panic-selling.
A Note on Long-Term Discipline
Remember that indicators are not a replacement for fundamental analysis. They are tools to help you frame your decisions within the context of the broader market. The greatest market indicator of all is not a number on a chart, but your own investment horizon and risk tolerance. In times of high volatility, the best strategy is often to stay the course, diversify intelligently, and avoid making emotional decisions based on short-term market noise.
Disclaimer: This article is for informational purposes only and does not constitute financial, investment, or legal advice. Market data and conditions change rapidly. Always conduct your own research or consult with a qualified financial advisor before making any investment decisions.